
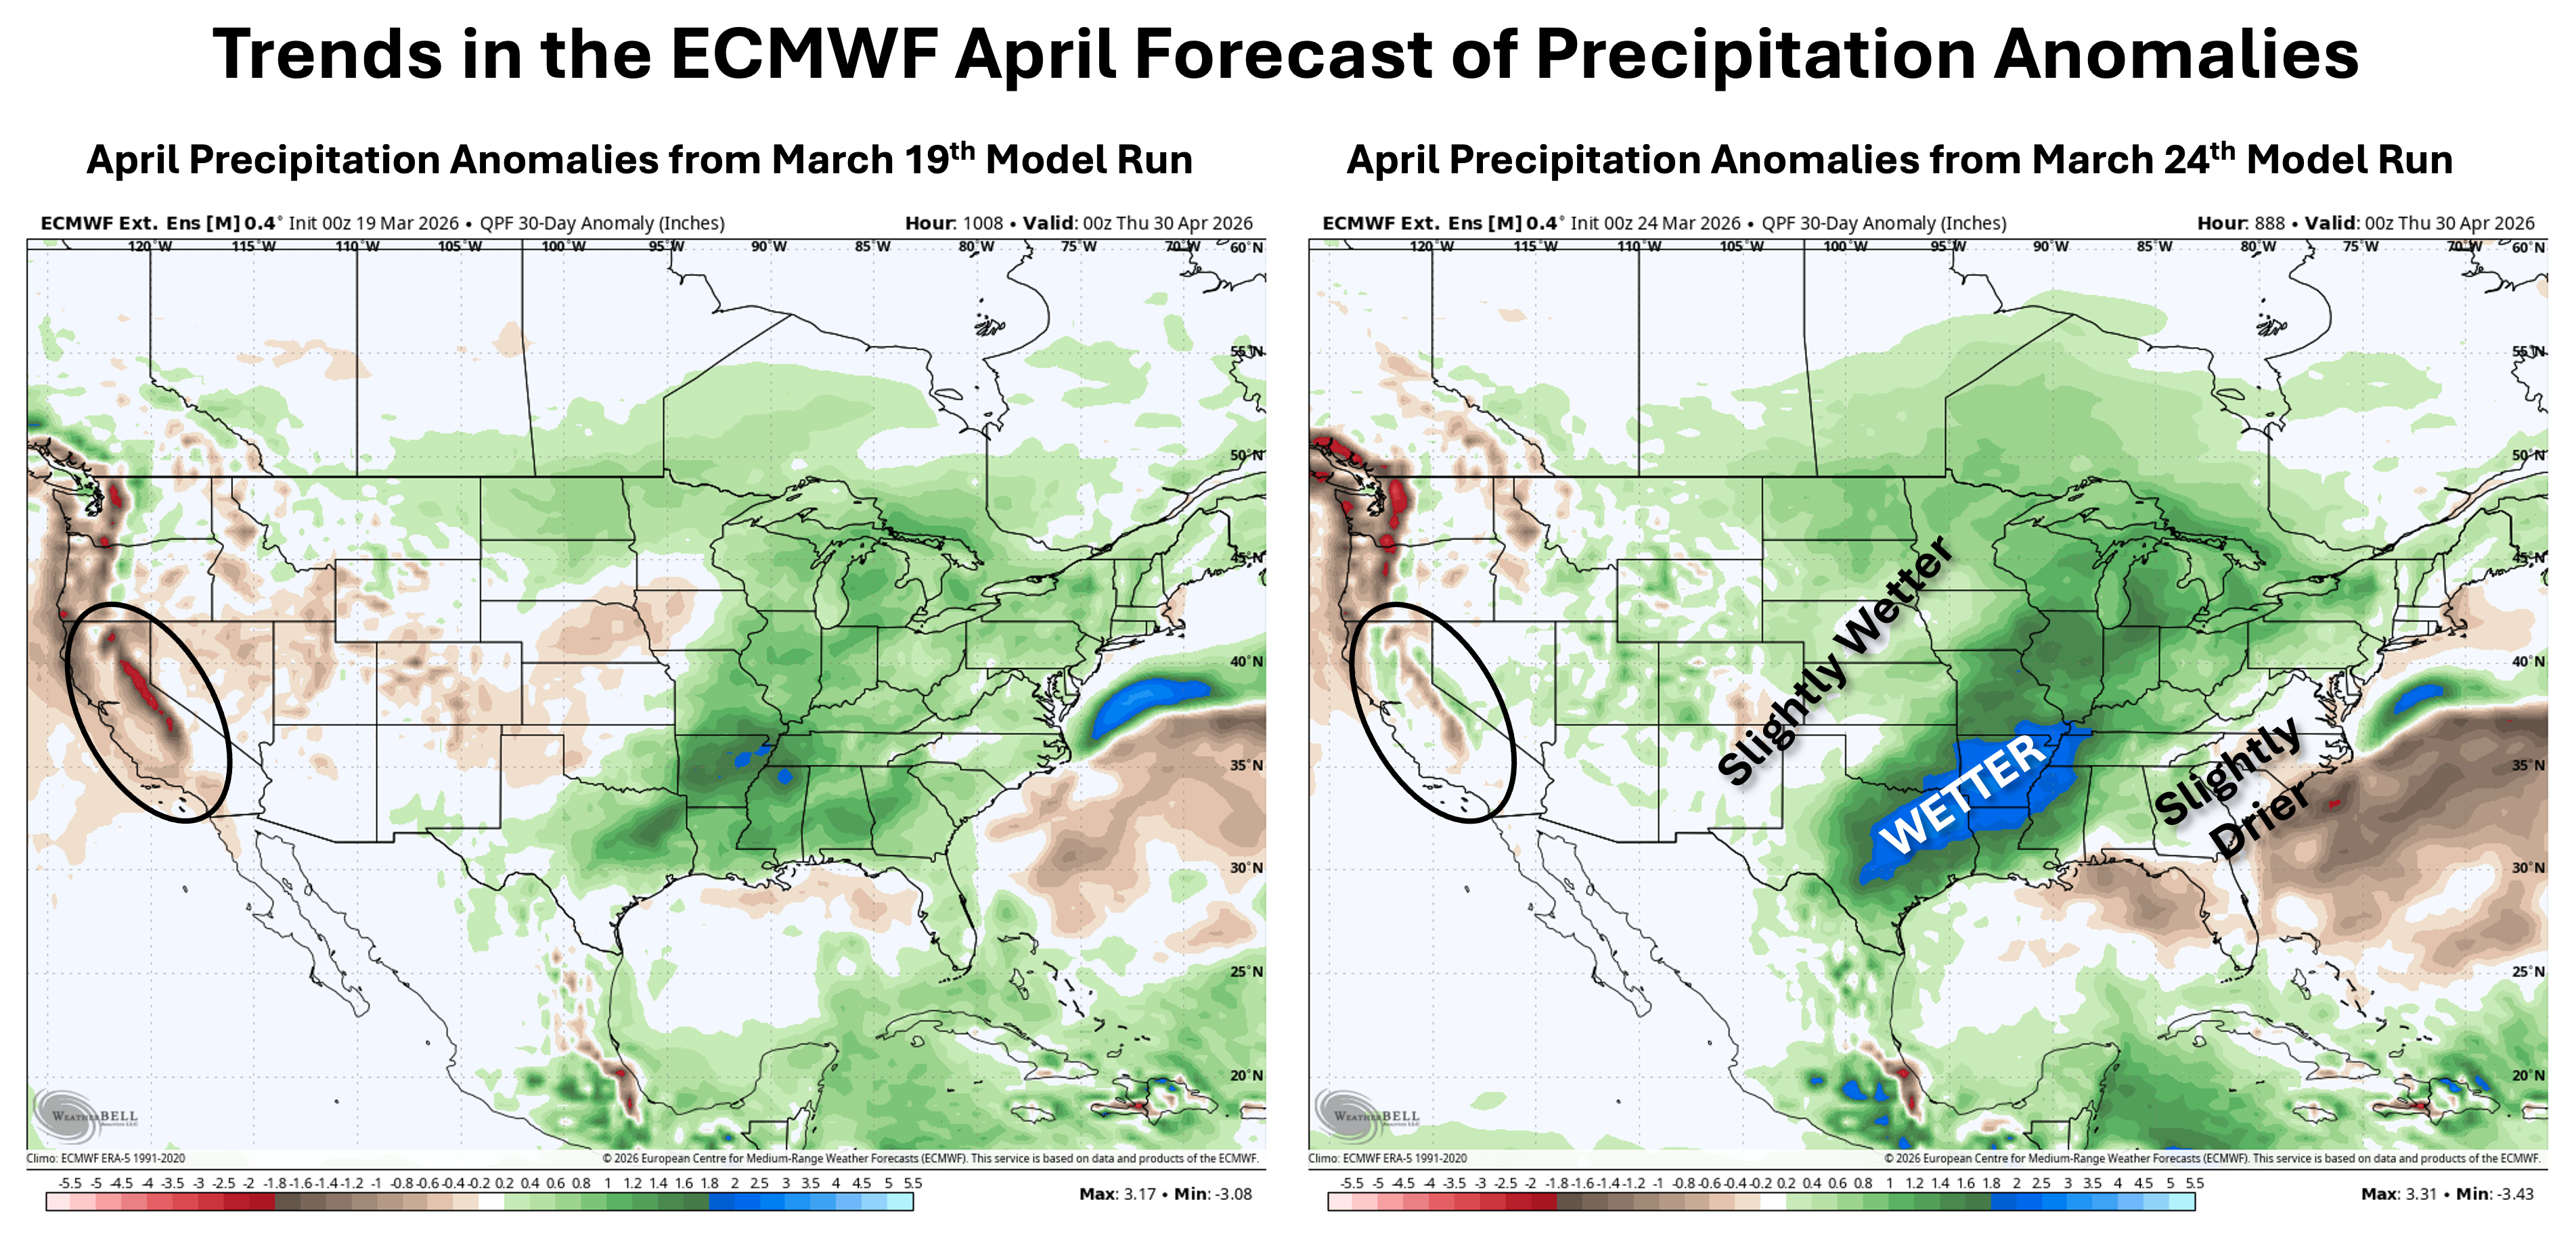
I've been watching the monthly forecast from the ECMWF for April 2026 total precipitation anomalies to see how consistent the model has been run-to-run. The last week has shown a notable trend as highlighted on the maps above. The way to interpret this map is to consider how often it forecasts the same pattern for a given time period (in this case April) and how the model trends (wetter or drier). There is increasing evidence that while April weather will be volatile (which is typical) the precipitation stats at the end of the month could match this pattern.